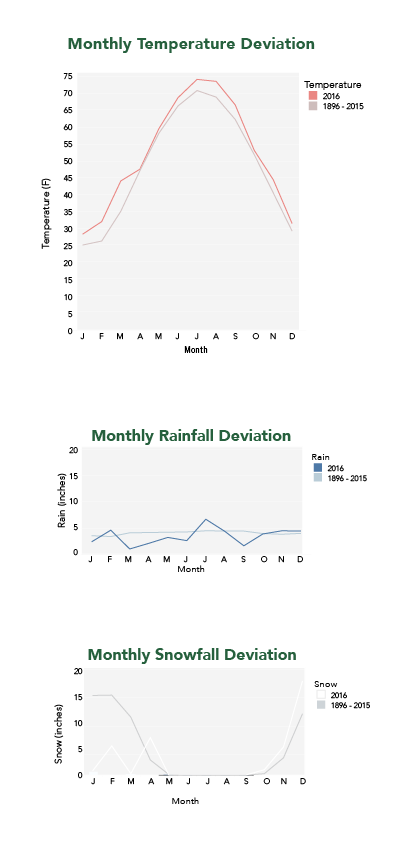
Final Visualizations:

Progress Sketches:
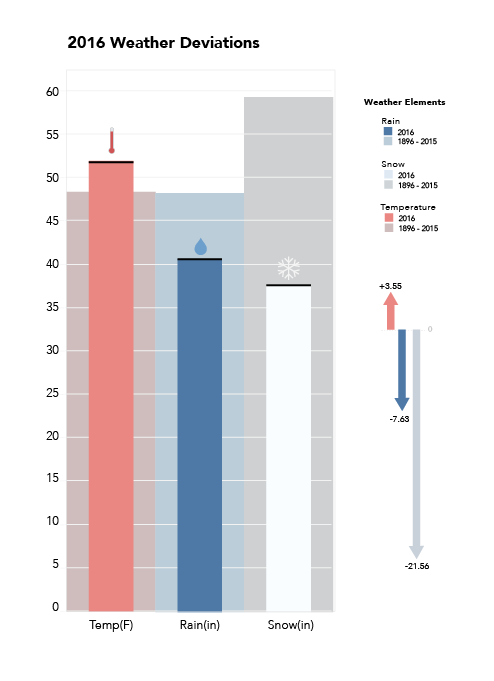
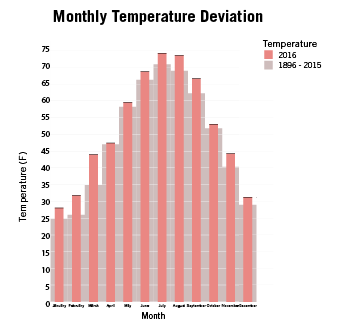
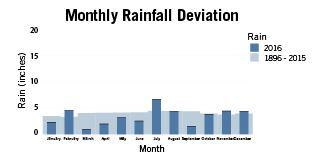
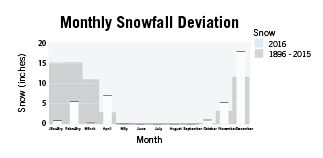
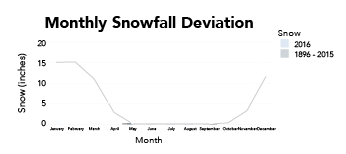
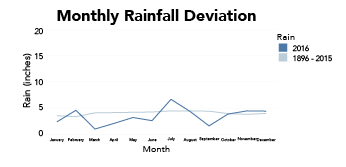
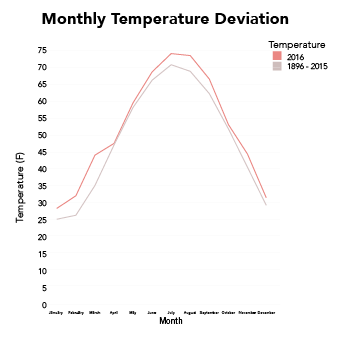
Using years of weather data from Mohonk Preserve and Tableau, I created data visualizations to easily display to the common reader the significance of the changes in climate between 2016 and the averages from 1896-2015. Final sketches are shown at the top, with progress sketches below.